Billions in federal Small Business Innovation Research (SBIR) funds are awarded each year to translate new ideas into commercial products—but not all states capitalize on the opportunity. Excel’s SBIR State Performance Index offers a new lens to assess and compare how well each region converts research, firms, and employment into SBIR awards, and then use this information to improve performance. From Hawaii’s nation-leading output to Alabama’s surprising efficiency, the index provides a new way for economic developers, tech transfer officers, and policymakers to understand and compare states’ performance at tapping into the powerful resource that is the national SBIR program.
SBIR State Performance Index
SBIR and Small Business Technology Transfer (STTR) award count is a common metric of a state’s innovation economy. However, raw comparisons are only somewhat meaningful, as vast size differences between the states could account for different levels of output. The most common approach to making a better comparison is award counts or funds per dollar of gross regional product (GRP). While this method does account for a state’s overall size in comparing SBIR performance, it does not weigh the state’s innovation economy.
The SBIR State Performance Index addresses factors overall economy size, higher education and business research expenditures, high tech firms, and research employment into an index that reports a state’s SBIR activity relative to the total U.S. rate of awards.
This single metric indicates how well a state’s companies earn SBIR awards relative to the size of its innovation economy.
Testing the index: Expected and surprising results
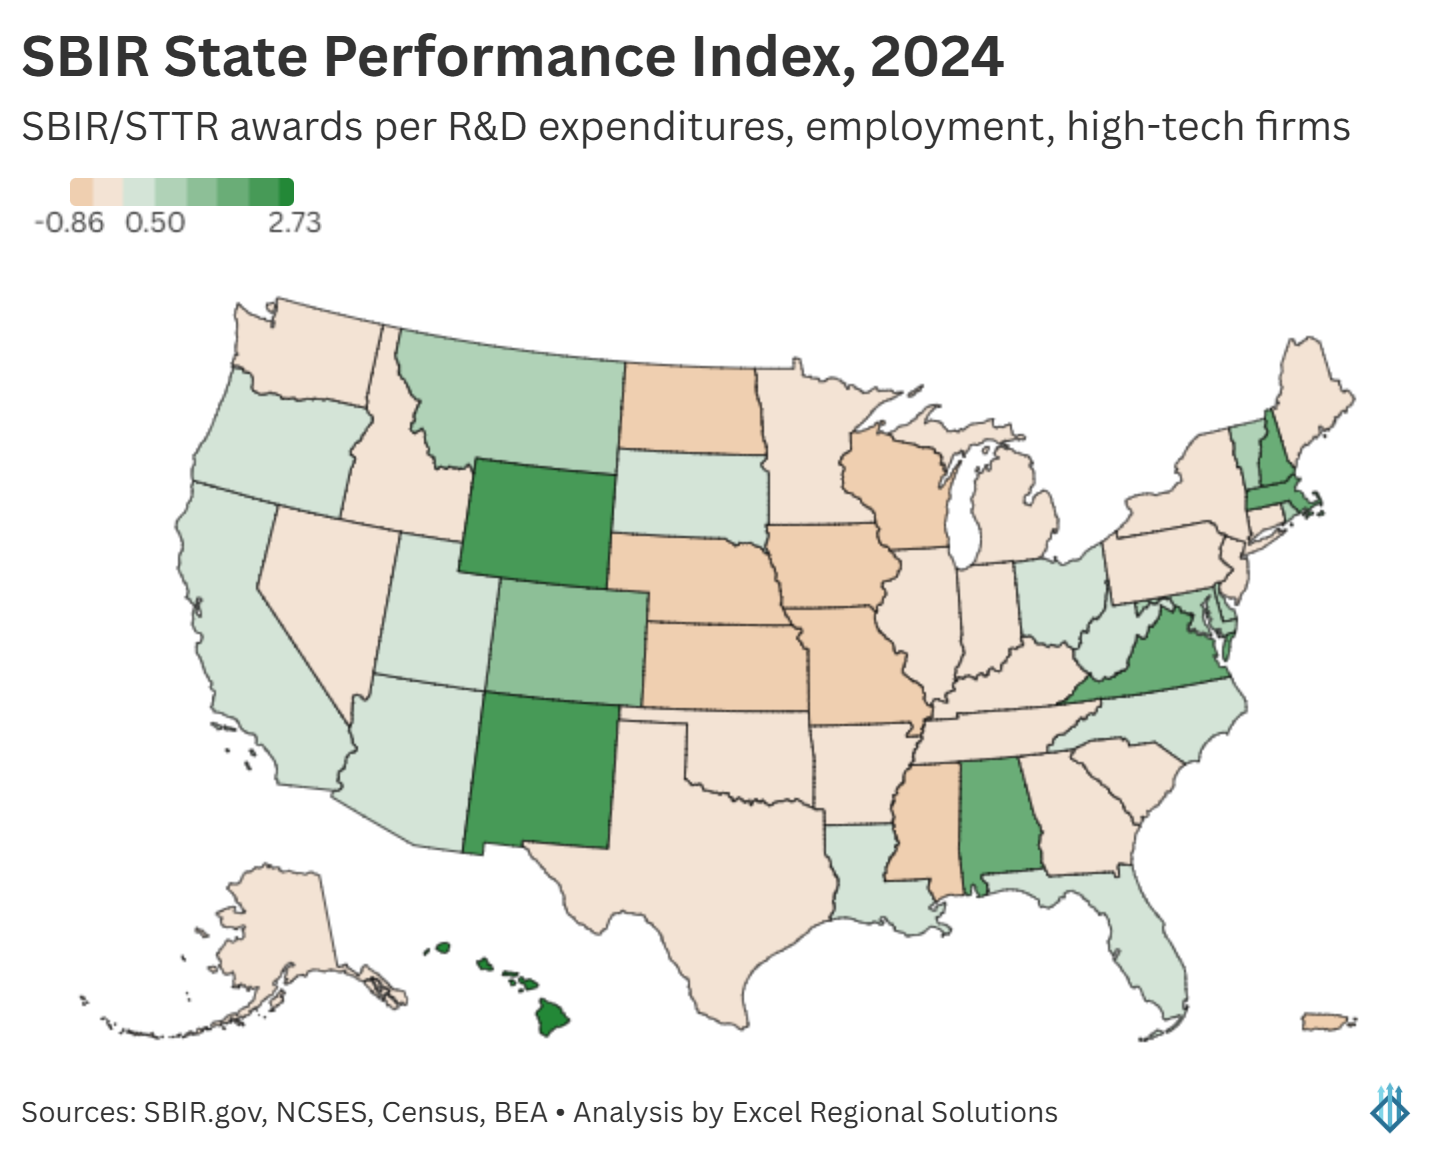
The SBIR State Performance Index for awards made 2022-2024 (more on the methodology, below) is displayed in the following map.
Some states perform as expected. Massachusetts has a stronger output for its economy than other states. So does California—but its modestly positive score aligns with the fact that the state’s attraction of one-fifth of all SBIR awards means that its performance strongly helps to drive the U.S. mean.
At the other end of the scale, size weighting does not appear to be overly favoring low performers: among the five states with fewer than 10 awards per year, only South Dakota rates a positive score (driven by a relatively strong rate of awards per dollar of business R&D spending).
There are some states that the index helps to illuminate. Hawai’i has the strongest score (2.73) among all states and has clearly earned the distinction: despite scoring in the bottom 10 for research spending, employment, high-tech firms, and GRP, it is 28th among states in SBIR awards—perhaps driven by the Hawai’i Technology Development Corporation’s long-term commitment to providing resources to its SBIR applicants. Alabama’s score (1.59) places it 6th among all states, and its performance may be aided by the 2021 formation of the Innovate Alabama and its matching grant program.
Texas has the distinction of being the state with the most SBIR awards (1,138 from 2022-2024, ranking 4th) that has a negative score (-0.21); Texas earns a lot of SBIR awards but at a rate slightly worse than the large size of its innovation economy would suggest.
Methodology
The numerator for each component of the SBIR State Performance Index is total SBIR and STTR Phase I and Phase II awards in a state from 2022-2024. Using a rolling average helps to smooth out results that could be skewed by oddities in award or reporting dates, in addition to the occasional single-year spikes or troughs in award activity.
The five denominators for the component scores are 2020-2022 data (the most recent years for which several sources are available) for the following:
- Gross regional product in 2017 chained dollars (from the U.S. Bureau of Economic Analysis)
- Higher education research and development expenditures (from the National Science Foundation)
- Business research and development expenditures (from the National Science Foundation)
- Business research and development employees (from the National Science Foundation)
- High tech firms (from the Census Bureau)
Each metric’s rate of SBIR awards is standardized against the other states using the total U.S. rate of performance as the mean.
The SBIR State Performance Index is the average of the five component scores.
How economic developers can use this index
The 2024 overall index is available here for states to understand their own SBIR award performance in the context of their state’s innovation economy, and as a comparative benchmark against peers and competitors.
For example, Ohio—for which I previously led a benchmark analysis of the state’s innovation economy—has a better score (0.48) than neighboring Pennsylvania (-0.01) and Florida (0.04), which Ohio’s policymakers view as a competitor, despite all three states attracting a similar number of awards (Ohio SBIR/STTR awards in 2022-2024: 761, Florida: 730, and Pennsylvania: 719).
The score means that Ohio’s companies are efficient at winning SBIR awards and suggests that the state’s programming to support proposals and commercialization are effective. On the other hand, because the SBIR State Performance Index measures efficiency, it may indicate that improving Ohio’s performance further would require a greater level of marginal effort than what a similar objective would require in Florida or particularly in Pennsylvania.
For a deeper dive into a state’s performance, one can use the data sources contributing to the index to track:
- SBIR State Performance Index trends over time
- The effect that higher education research, business research, research employment, and high-tech firms have on the state’s composite index score
- Different levels of performance across federal agencies
- How well SBIR awards are distributed to companies across the state
Of course, state practitioners instead can hire Excel Regional Solutions to produce a detailed and cost-effective SBIR analysis. Contact info@excelregions.com to get started.
Update, June 3, 2025: Download the SBIR State Performance Index scores at the linked spreadsheet. Component scores and data are available as part of an SBIR or comprehensive regional analysis.